What is R and what can I do with it?
The programming language R is well known for statistics. R was developed in the 90's at Bell Laboratories (formerly AT&T, now Lucent Technologies) by John Chambers and colleagues. It is based on the S programming language (S for Statistics, yes they were very creative). More than a programming language for statistics, R enables to manipulate data and to perform very powerful graphical representations. It is widely used and benefits from a large community that provides updates and new 'programs'.
IMPORTANT: In R, we do not speak about 'program' but about 'package' or 'library'
Widely used in academia, biologists and bioinformaticians quickly developed a community of users who shared their packages. An example is Bioconductor that provides around 1,500 packages to the bioinformatics community.
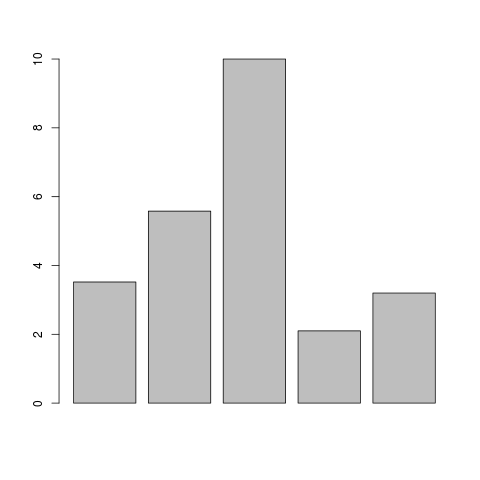
Let's now take a simple example of a typical use of R. When performing a RT-PCR, you have a serie of values to represent with a barplot. Below is how to do it with R:
> pcr_values <- c(3.52, 5.58, 10, 2.1, 3.2)
> barplot(pcr_values)
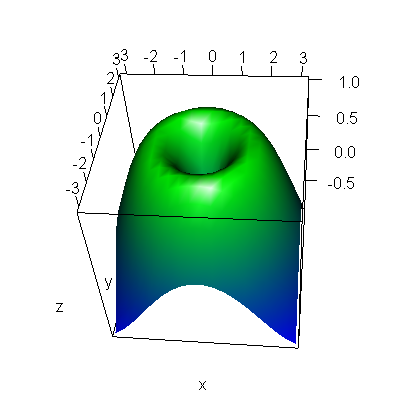
It is simple as this! You can also obtain some very fancy plots:
In summary, R enables you to process, organize, analyze and represent your biological data in a powerful manner. But to start playing with your data, you need to learn the basics. In the next section, we are going to see how to use R at EMBL and begin to play with the command line.